What is OPS in Baseball: A Comprehensive Guide to On-Base Plus Slugging Stats!
If you’ve ever wondered ‘What is OPS in baseball?’ you’re not alone. OPS stands for On-Base Plus Slugging, a stat that marries a hitter’s on-base ability with their slugging power to evaluate their offensive prowess.
In this article, you’ll explore the components that make up OPS, understand how it’s calculated, and discover why it’s a significant measure in the sport of baseball.
Key Takeaways
- OPS is a valuable baseball statistic combining On-Base Percentage (OBP) and Slugging Percentage (SLG), offering a comprehensive view of a player’s offensive performance by measuring their ability to get on base and their power hitting.
- On-Base Percentage (OBP) is calculated using hits, walks, and times hit by pitch, reflecting a batter’s plate discipline, while Slugging Percentage (SLG) considers the worth of each type of hit (emphasizing extra-base hits) to evaluate a player’s batting power.
- Benchmarks for OPS quality exist: an OPS over .800 is considered very good, between .700 and .800 is average, below .700 is considered below average in MLB, and Adjusted OPS (OPS+) is normalized to enable fair comparisons across different playing conditions.
Exploring OPS: The Fusion of Two Critical Hitting Metrics

OPS, which stands for On-Base plus Slugging, combines two critical offensive statistics in baseball.
It effectively brings together a player’s adeptness at reaching base (OBP) with their slugging power (SLG), providing a robust measure of an athlete’s contribution to the offense.
To calculate OPS, one simply adds up the on-base percentage and slugging percentage.
In the realm of baseball analytics, OPS has risen to prominence as it delivers a more holistic view of a player’s offensive prowess than other individual metrics do.
This statistic melds both consistency in getting on base and proficiency in hitting for extra bases into one metric that showcases how much value players add to their team’s scoring efforts.
As such, OPS has revolutionized our evaluation methods by becoming essential within modern evaluations of player performance.
Read Also: What is WHIP in Baseball
The Components of OPS: OBP and SLG Detailed
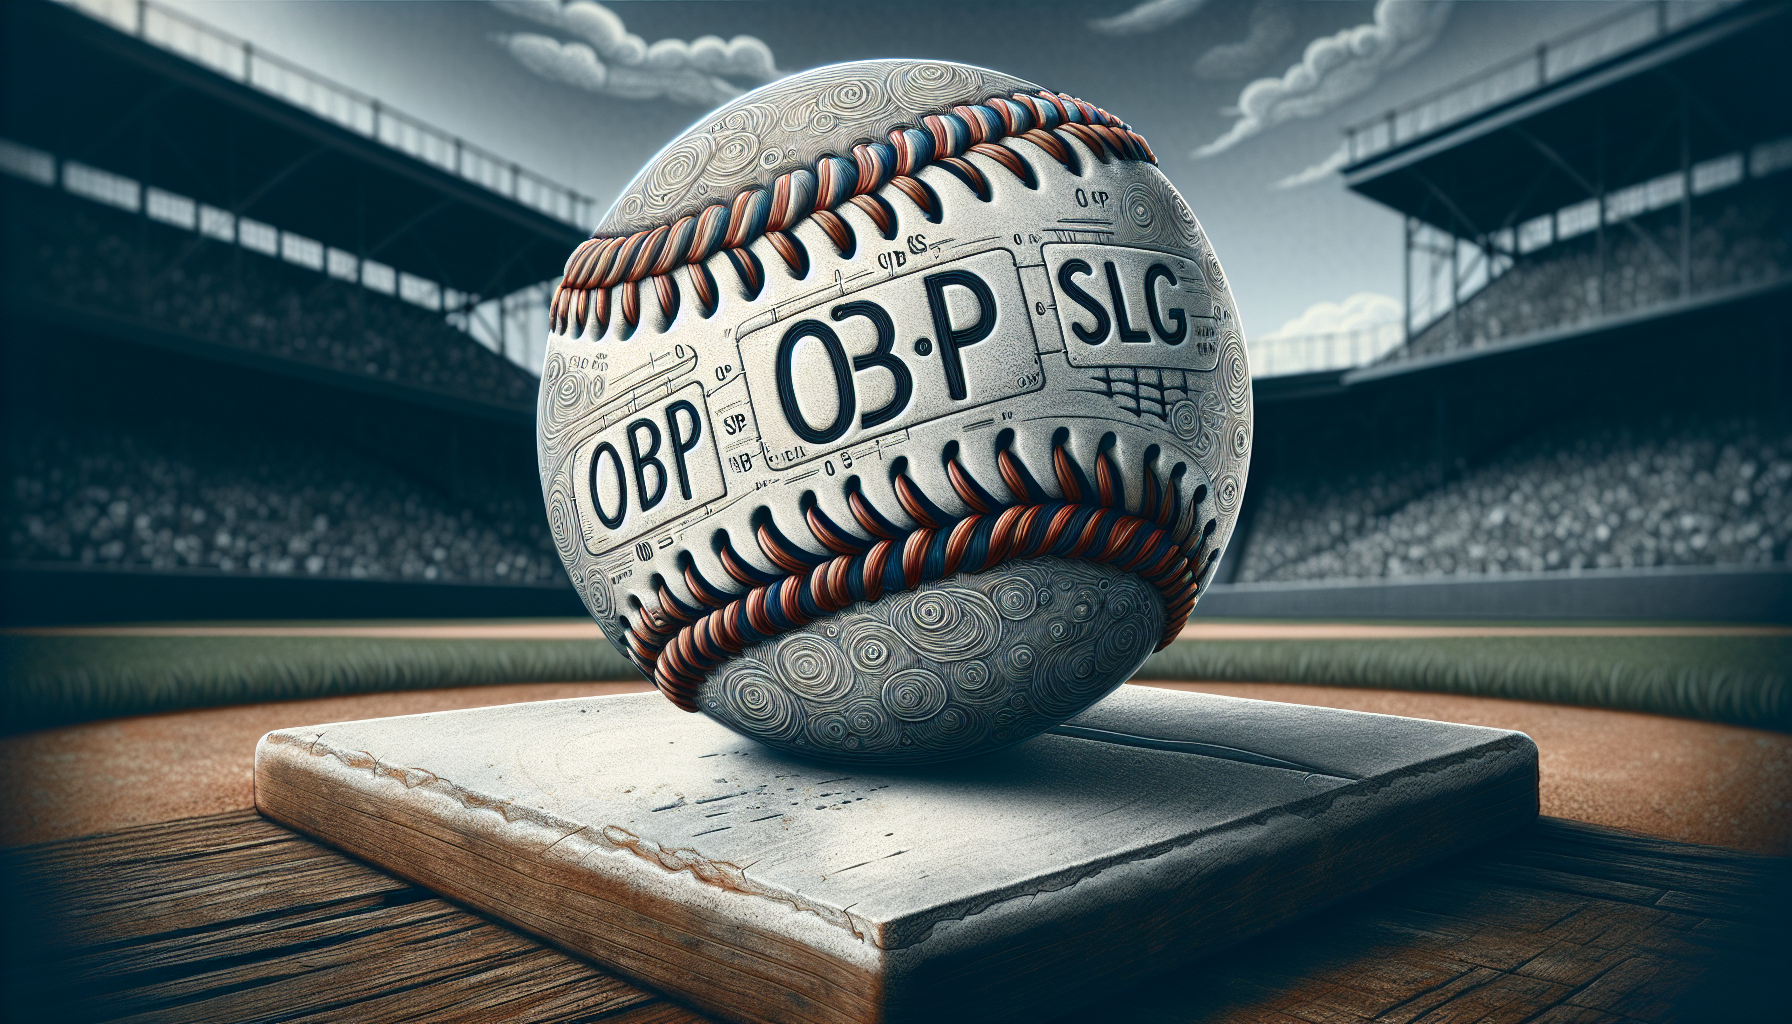
To understand OPS, one must first become acquainted with its constituent elements: On Base Percentage (OBP) and Slugging Percentage (SLG). Each metric offers distinct perspectives on a player’s performance.
On Base Percentage evaluates the frequency at which a hitter gets on base, whereas Slugging Percentage provides an assessment of their hitting power.
Each component will be examined individually to better appreciate how they contribute to the composite measure of OPS.
On-Base Percentage (OBP): The Measure of Plate Discipline
The On-Base Percentage (OBP) is an important statistic that gauges how often a batter gets on base by including instances of hits, walks, and being hit by a pitch. This percentage offers a thorough evaluation of a player’s proficiency in reaching base.
The way to compute OBP is with the equation (H + BB + HBP) / (AB + BB + HBP + SF), where ‘H’ indicates hits earned, ‘BB’ reflects walks or bases on balls received, ‘HBP’ is times hit by pitch, ‘AB’ denotes at bats a player has had, and ‘SF’ refers to sacrifice flies.
But there’s more depth to OBP than just measuring hitting ability. It also captures the overall plate discipline of a player.
Walks are factored into its formula because they represent not only reaching base but also demonstrating patience and judgment in identifying suitable pitches—attributes emblematic of high-percentage batters who excel at distinguishing between good pitches worthy of swinging for and those best left alone.
Slugging Percentage (SLG): Power at the Plate
Slugging percentage (SLG) follows the on-base percentage in evaluating a hitter’s power. It is calculated by dividing the sum of all bases from hits by the total number of at bats, giving more weight to hits like doubles, triples, and home runs. A home run counts four times as much as a single within this metric.
Similarly, a triple is valued three times higher than a single and doubles twice as much. The slugging formula consists of: singles plus doubles multiplied by two plus triples multiplied by three plus home runs multiplied by four all divided by at-bats.
In contrast to batting average which treats every hit equally, SLG differentiates among various hit outcomes based on their value in terms of base advancement per at bat.
This method gauges an individual’s hitting strength by focusing on how many total bases are earned with each swing—underscoring extra-base hits, unlike batting average, does—which makes it pivotal for calculating OPS (on-base plus slugging).
See Also: What is RBI in Baseball
Calculating a Batter’s OPS: A Step-by-Step Guide
To calculate OPS, we merely sum the player’s On-base Percentage (OBP) and Slugging Percentage (SLG).
For example, a batter with an OBP of.350 combined with an SLG of.450 would yield an OPS of.800. The process is remarkably simple.
OPS may be uncomplicated to comprehend, but it plays an important role in baseball analytics. It encapsulates critical elements that reflect a player’s batting capabilities, which makes it widely used for assessing offensive skills.
Although lacking intricate detail, the straightforwardness and utility of OPS have solidified its status within baseball statistics as well as within fielding metrics.
The Significance of OPS in Player Evaluation
OPS plays a vital role in evaluating players. By combining a player’s ability to get on base (OBP) and hit for power (SLG), OPS offers a more complete picture of a player’s hitting performance than the batting average.
It not only includes walks and sacrifice flies but also reflects a player’s chances to score, ultimately influencing team victories.
OPS, as a measurement tool, covers a wide array of stats, including total plate appearances, walks, and strikeouts.
It serves as a valuable indication of a player’s productivity and has a demonstrated correlation with a team’s success in terms of runs scored and games won, making each plate appearance crucial.
In essence, a player’s OPS can be a game-changer in the world of baseball, making it an integral part of a player’s ability evaluation, just like a well-executed fielder’s choice in a team game.
Read Also: What Does WAR Mean in Baseball
Benchmarking Excellence: What Constitutes a Strong OPS?

We need benchmarks to evaluate a player’s performance using OPS. An OPS of 1.000 is often seen as the pinnacle of hitting performance, aptly nicknamed the ‘holy grail’ of OPS.
Hitters with an OPS above .800 are considered above average or very good, indicating their effectiveness at the plate.
On the other hand, an OPS in the range of .700 to .800 is considered average in MLB, with recent seasons showing a typical average hovering around the mid-700s.
OPS values below .700 are generally viewed as insufficient, indicating a below-average offensive performance in the major leagues.
When it comes to OPS+, a score over 150 marks excellent performance, around 125 is very good, while a score below 75 represents poor hitting. These benchmarks provide a clear framework for evaluating a player’s OPS.
OPS in Historical Context: Legends of the Statistic
OPS is not just a number. It tells the story of baseball’s progression. This measure has endured, providing a window into players’ batting prowess throughout various periods.
The credibility of OPS as an indicator of performance can be seen in its reflection by prominent MLB figures who have upheld high career OPS values like:
- Babe Ruth
- Ted Williams
- Barry Bonds
- Albert Pujols
Each consistently showed exceptional on-base capabilities and power-hitting skills that categorize them among baseball’s elite hitters.
To remember the past and highlight some amazing achievements, let’s take a look at these well-known people and their outstanding OPS (On-base Plus Slugging) records in baseball.
MLB’s All-Time OPS Leaders
At the pinnacle of Major League Baseball’s all-time career OPS leaders sits Babe Ruth, boasting an impressive 1.1636 record.
This illustrious list features iconic figures like Ted Williams, Lou Gehrig, Barry Bonds, and Jimmie Foxx—each demonstrating extraordinary talent at bat throughout their time in MLB.
The select circle with a lifetime OPS surpassing the 1.000 mark Includes:
- Oscar Charleston
- Turkey Stearnes
- Mule Suttles
- Hank Greenberg
- Rogers Hornsby
Such outstanding players emphasize not only their dominance but also the durability of their skill as hitters within baseball’s storied annals.
Memorable Single-Season OPS Achievements
Barry Bonds holds the record for the highest single-season OPS, an astonishing 1.4217 achieved in 2004.
This illustrious group of top OPS performers in a season frequently features inductees from the Baseball Hall of Fame, highlighting their outstanding talents as players.
In baseball lore, Ted Williams’s notable single-season OPS from 1941 reinforces his legendary stature within the sport.
Meanwhile, Rogers Hornsby is celebrated for achieving the greatest single-season OPS by a right-handed batter—a remarkable 1.2449 back in 1925—underscoring the significant role that OPS plays in evaluating baseball excellence.
See Also: What is RPI in Baseball
Adjusted OPS (OPS+): Leveling the Playing Field

OPS, though full of valuable data, can be skewed by factors such as park and league conditions. Adjusted OPS or OPS+ comes into play to address this skewness.
By adjusting for these external variables, OPS+ transforms the traditional statistic of on-base plus slugging (OPS) into a more equitable metric that allows for an accurate comparison between players in varying contexts and eras unlike just using the average ops.
Here’s how the scale works for OPS+:
- The benchmark set at 100 represents the league average.
- An individual player’s performance is considered above-average if their OPS+ exceeds 100.
- Conversely, registering an OPS+ below 100 points toward subpar performance compared to peers.
Through considering different elements affecting outcomes, Adjusted On-base Plus Slugging provides a deeper and unbiased perspective when evaluating a baseball player’s contributions at bat relative to others within the sport.
OPS: Beyond the Batter’s Box
OPS’s impact transcends the confines of a batter’s performance at the plate. It plays a significant role in contemporary baseball tactics, such as sabermetrics, and has a substantial influence on player acquisition decisions and contract negotiations.
In shaping batting orders to maximize plate appearances and increase baserunner chances, teams frequently utilize OPS data to inform their strategies.
Within front office operations, OPS is instrumental in assessing a team’s offensive prowess which guides critical moves like drafting new players or structuring lineups.
During contractual negotiations with players, ops often become an essential metric that shapes salary offerings and terms by reflecting a player’s offensive contributions.
The application of OPS thus reaches far into various operational facets beyond just appraising individual performances within baseball.
The Evolution of OPS in Baseball Analytics
The development of OPS as a key indicator in baseball analytics tells an engaging tale. With the advent of sabermetrics, OPS became a critical metric in redefining how players are evaluated, with emphasis placed on their ability to not only get on base but also generate extra-base hits.
The publication ‘The Hidden Game of Baseball’ by John Thorn in 1984 played a pivotal role in introducing OPS more broadly within the baseball fraternity.
OPS gained Legitimacy through the endorsement by renowned baseball journalist Peter Gammons, which helped cement its status among both aficionados and industry experts.
Its prominence expanded when The New York Times started publishing weekly statistics columns that featured leaders in OPS from 2004 onwards.
Topps began to print player cards with included OPS data starting that same year — evidence of its growing resonance with fans and collectors alike.
Databases like Baseball-Reference continue to feature both traditional stats such as On-base Plus Slugging (OPS) along with normalized versions like adjusted ops+ (OPS+) for comprehensive player evaluation even amidst newer analytics tools available today.
Critiques and Limitations of OPS
OPS, like many other statistical measures, is not without its detractors and inherent weaknesses.
A significant point of contention with OPS is that it simply adds together on-base percentage and slugging percentage while neglecting to consider their distinct scales, thus compromising the statistic’s mathematical integrity.
Also, many people think getting on base is more important for scoring runs than just hitting hard. But OPS treats both as equally important. This means players who hit a lot of home runs might look better in OPS than those who are good at getting on base.
So, when we use OPS to judge how good a player is, we need to remember these issues. It’s a useful stat, but it doesn’t tell the whole story.
Summary
We’ve come a long way on our OPS journey, exploring its components, calculation, significance, and historical context. OPS, a fusion of On-Base Percentage and Slugging Percentage, offers a comprehensive assessment of a player’s offensive capabilities.
It is a preferred metric for evaluating a player’s contribution to the team’s offense, and its benchmarks provide a clear framework for performance evaluation.
While OPS has its limitations, its evolution in baseball analytics and its wide application in sabermetrics, player acquisitions, and contract negotiations underscore its importance in understanding a player’s hitting performance.
As we explore the world of baseball statistics, let’s continue to embrace OPS as a powerful tool that brings us closer to the heart of the game.
Frequently Asked Questions
How is OPS in baseball calculated?
In baseball, the calculation of OPS involves taking the sum of a player’s on base percentage (OBP) and slugging percentage (SLG), which are then averaged by dividing by two. For a straightforward computation, one might utilize resources such as Baseball Reference.
What does OPS stand for in baseball?
In baseball, OPS is an acronym for On Base Plus Slugging, which merges the measurement of a player’s ability to get on base with their power-hitting prowess. This statistical metric is commonly employed to assess a player’s proficiency at the plate regarding offensive contributions.
What constitutes a good OPS?
Typically, a good OPS (On-base plus slugging) exceeds .800, while achieving an OPS of 1.000 is unusual and considered highly remarkable.
On the other hand, if an OPS falls below .700, it indicates a performance that is less than average.
Who are some of the all-time OPS leaders in MLB?
In MLB history, figures such as Babe Ruth, Ted Williams, Barry Bonds, Lou Gehrig, and Jimmie Foxx stand out among the leading OPS (On-base plus slugging) leaders. Their contributions have had a lasting effect on baseball.
What are the limitations of OPS?
One significant drawback of OPS is that it merges On-base Plus Slugging (OBP) and Slugging Percentage (SLG), despite them having distinct denominational foundations, which may result in disproportionately emphasizing SLG as both are given equal importance.
It’s important to be aware of these shortcomings when employing OPS as a metric for player evaluation.
